Table Of Contents
Finally, let’s start testing what we’ve done so far, gather data to improve, and set up monitoring for long-term success.
In this series I’ll show how to create a simple, fast and security-conscious blog.
Part 1: Hosting / installation
Part 2: Plugins, upgrading PHP, HTTP security headers
Part 3: Caching, WAF and Optimizations
Part 4: Monitoring and performance testing
Scanning
The most important things in security and performance, more than anything else I’d say is: measure, measure, measure, and when you have all the info, set up automatic measuring and alerts. We’ve already set up scanning for some basic things like malware, but there’s a lot more to scan for.
SSL / Encryption settings / strength
https://www.ssllabs.com/ssltest/
SSL Server Test from Qualys will test the SSL/TLS configuration of your website, and provide you a lot of details about your encryption capabilities, known vulnerabilities and identify misconfigurations. Using the settings configured so far, your grade should be A+, but that can change as new threats are discovered, so you should check this regularly.

Synthetic Monitoring / Site performance on different devices and bandwidth
WebPageTest
Synthetic monitoring allows you to test your site on specific device configurations, and see what a user with that same device / bandwidth is expected to see when loading your site. It also allows you to retest the site under controlled conditions, to see changes in site performance as you update settings or add new features.
I find good starter settings to be using a 3G Fast (1.6 Mbps/768 Kbps 150ms RTT) connection, running 3 tests (and looking at the middle one), and First View Only with Capture Video. Repeat views are also interesting once you’re caching everything, but the first view will give you a really good baseline to optimize for in most cases.
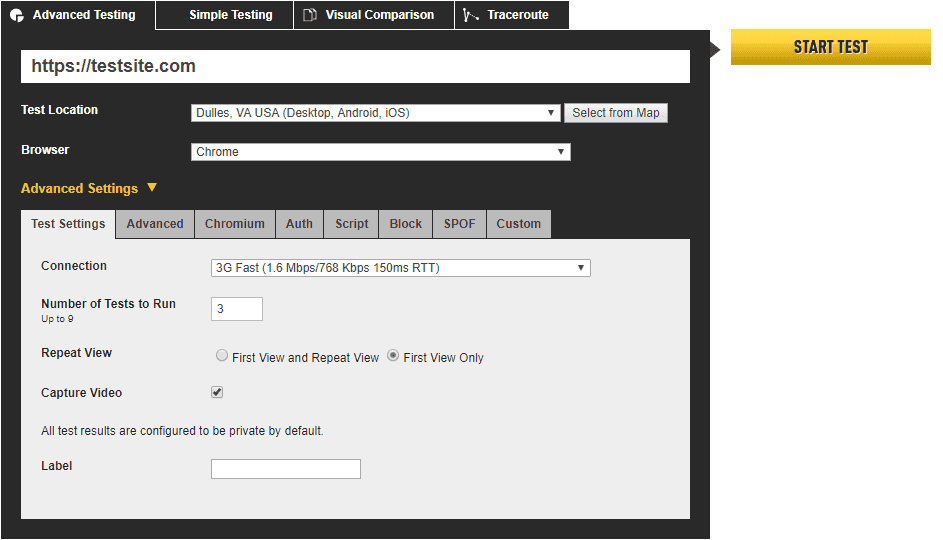
Then click Start test, and you should start seeing test results in 30-60 seconds, and you should end up with something like this:
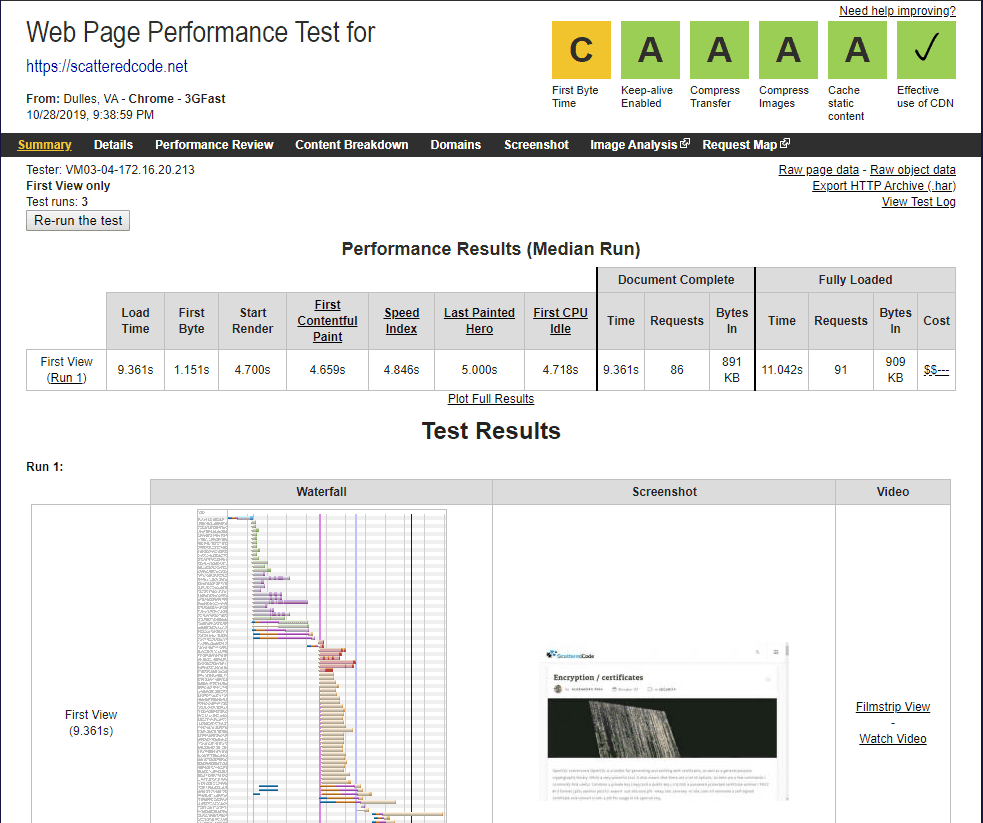
There’s a lot of performance data here, so let’s start understanding it.
In the first part we’ll have some grades, which will give us a high-level picture of how we’re doing. Some of this will depend greatly on the type of connection you test with, but if you optimize for the slower connections, the faster ones will benefit as well.

As you can see, the site is fairly optimized, but it looked a very bad the first time I ran it on my blog, especially before I added Cloudflare.
The First Byte time is typically the processing time on your server, plus the latency of the user’s connection. If I aggressively cache on the edge, then this would be an A as well, might do that later.
Keep-Alive is an HTTP header that allows for the connection between a browser and a server to stay open, allowing the transfer of multiple files over a single connection. Clicking on this grade will show you resources that don’t set this header.
You should use gzip compression for transferring compressible content (html, css, js and images). This can save quite a lot of bandwidth.
Cache static content refers to properly set cache headers, which cache for an adequate amount of time. Clicking on this will show you resources that don’t cache or have a short cache period.

Next, we have relevant numbers. I find the following most useful:
Load Time is measured as the time from the start of the initial navigation until the beginning of the window load event.
The Start Render time is the first point in time that something was displayed to the screen. Before this point in time the user was staring at a blank page. This does not necessarily mean the user saw the page content, it could just be something as simple as a background color but it is the first indication of something happening for the user.
The First CPU Idle is a newer metric and reports when the page is first expected to be usable and will respond to input quickly.
Next, click on the waterfall picture, which will open up the full waterfall view with a lot more detail. Now we can start to dive into what’s actually holding requests up.
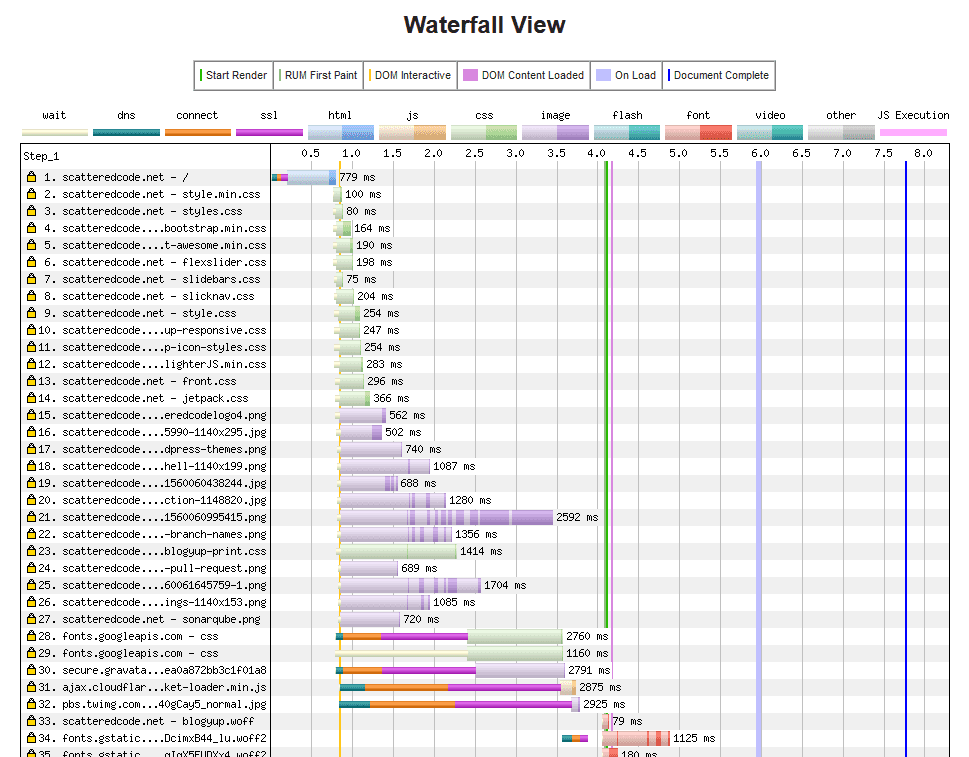
As you can see, the site takes almost 8 seconds until it’s completely done loading. However, all the css and images start loading around the 1.2 second mark, and the user can see the site around 4.5 seconds. The main delay we can see is that we’re waiting for fonts to load. A good practice now would be to find an alternate font that looks close to our custom font, and async load our custom font and replace it once the font is available.
I really recommend watching this talk called Happy Browser, Happy User from the NY Performance meetup: https://www.youtube.com/watch?v=QF_re96w1PY. Katie goes into deep detail about the parsing order of the DOM, loading and execution of files, and what to pay attention to when optimizing. This is one of my favorite talks.
https://docs.webpagetest.org/getting-started/
AMP
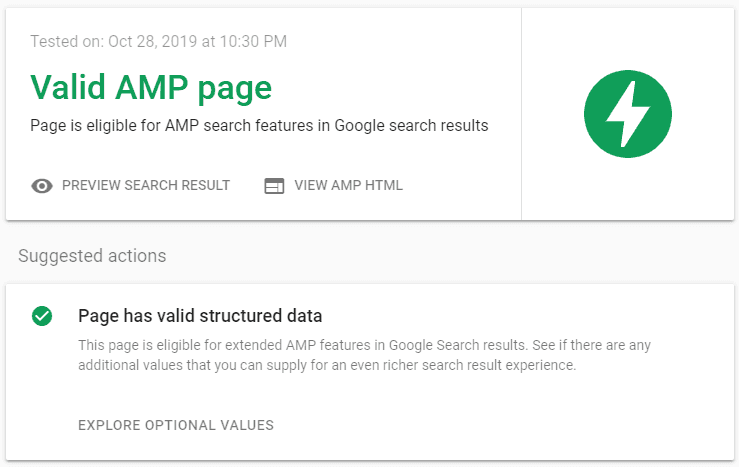
AMP or an Accelerated Mobile Page is an HTML page that is lightweight and stripped down. The mobile user gets a much-improved experience: content is faster, more engaging, and easier-to-read. This site will offer suggestions on things you can improve to deliver a better AMP experience to users.
https://search.google.com/test/amp
I recommend watching the video on AMP rules https://www.youtube.com/watch?v=9Cfxm7cikMY
Real User Monitoring
While synthetic tests allow you to simulate what users experience, RUM tells you what users that have been to your site have experienced.
Google Analytics
https://analytics.google.com/analytics/web/
Google Analytics is the de facto statistics collection and analysis tool for the web. It tracks everything from traffic sources, user behavior, acquisition, audience analysis, to conversions, and further integrates with other datasources.
The reports I find most useful are the audience overview, just to see information about how many users visit my site, new vs returning, pages visited per session, and time spent on site. You can find this by going to Audience -> Overview in Google Analytics.

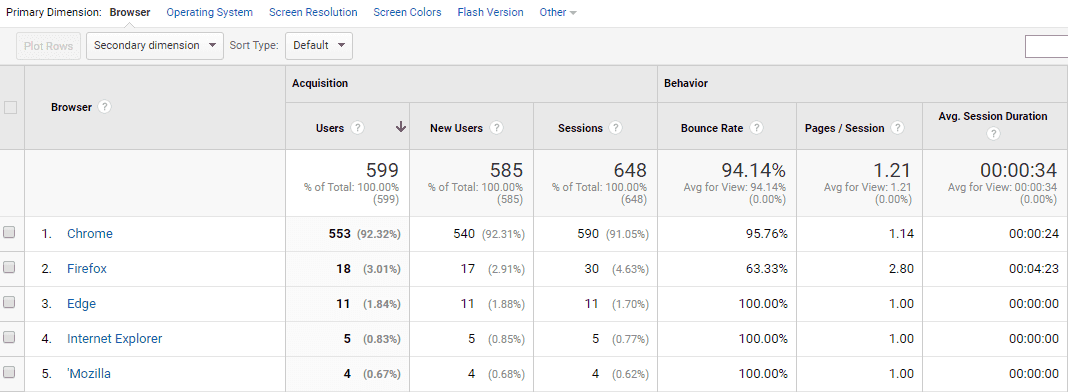
The next report I find useful is knowing the technology users use, this is under Audience -> Technology -> Browser & OS
Another interesting report is under Behavior -> Behavior Flow, which will show the order and dropoff of users navigating through your pages
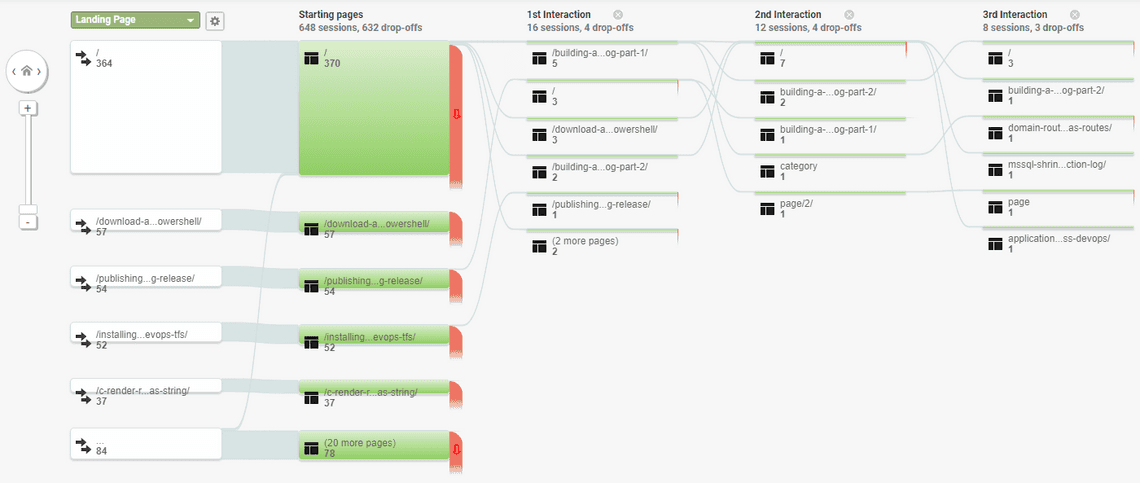
There are a lot of really useful insights in analytics, and a lot to browse through.
PageSpeed Insights
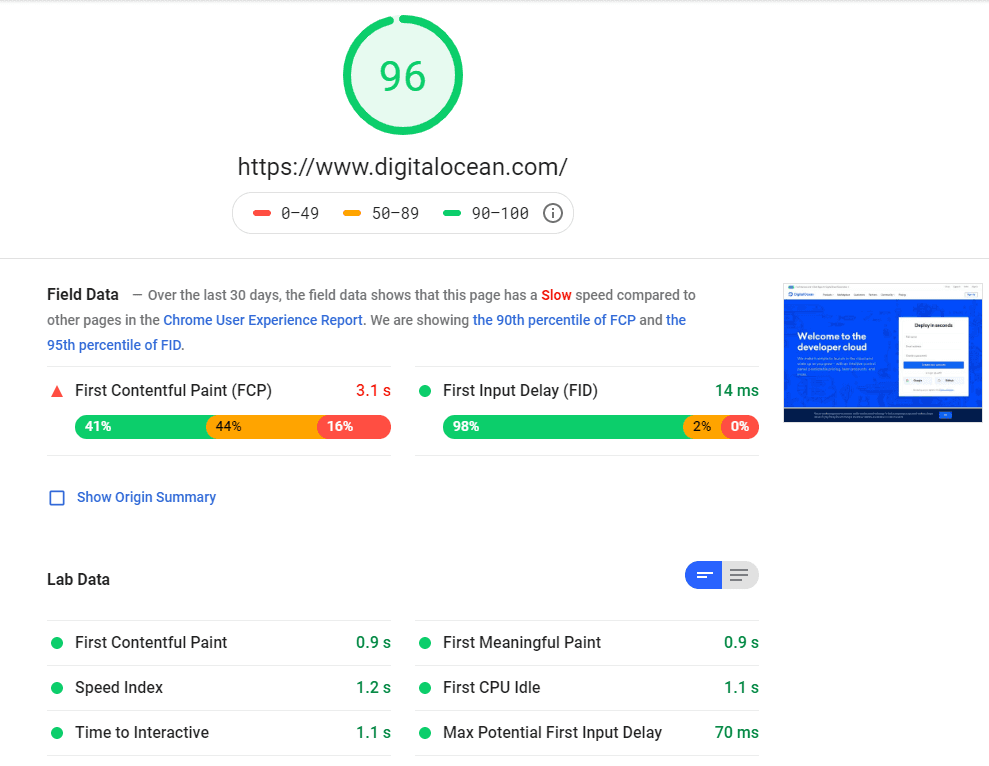
A great resource for both is Google PageSpeed Insights, especially if your webiste has a lot of traffic. This site will run synthetic tests, as well as use data collected from Chrome experience reports to summarize real user experience on your website.
https://developers.google.com/speed/pagespeed/insights/
Application and server monitoring
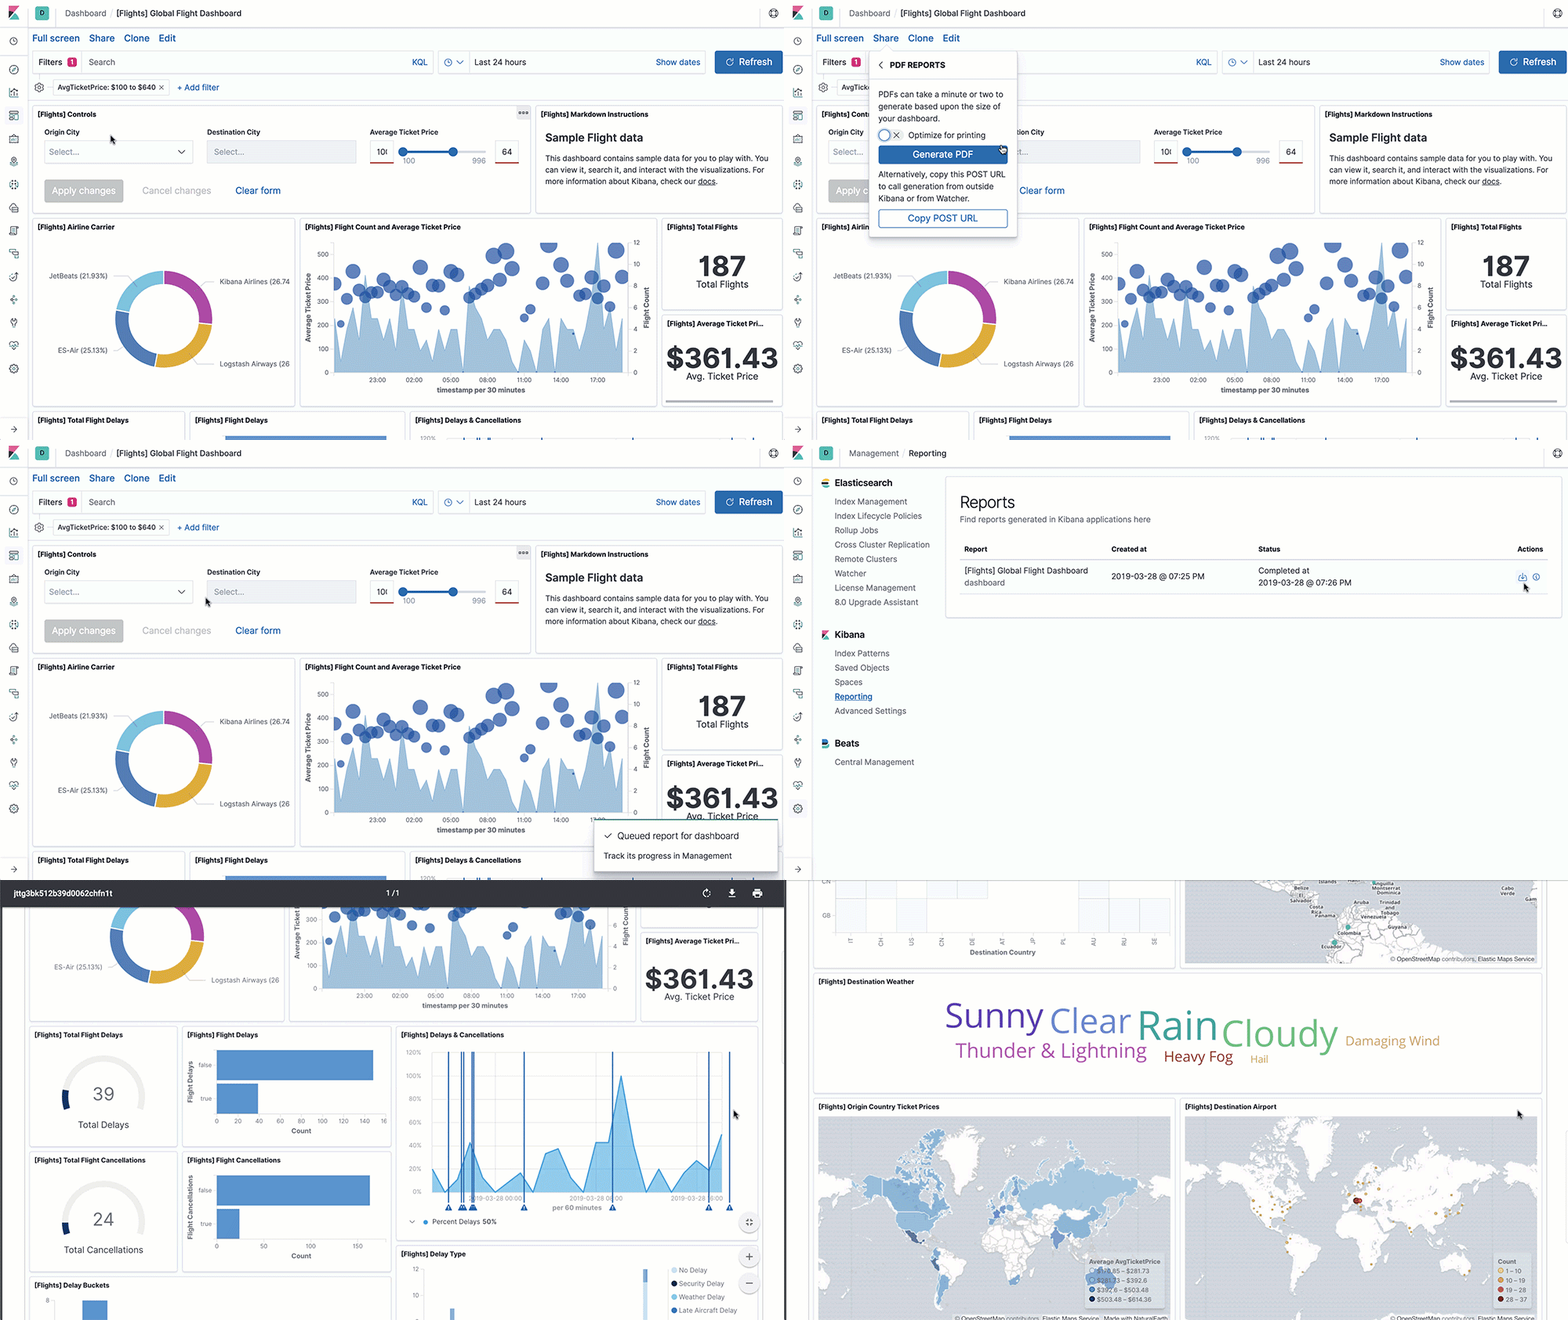
Next, it’s time to monitor our stack. Elastic cloud makes setting up the elastic stack painless, and you can immediately get access to great monitoring tools, and it allows you to monitor and report on pretty much any type of data you can think of. Check out https://demo.elastic.co for a taste. From text log aggregation and all types of metrics, to machine learning, APM, SIEM and much more; it really helps you get a very clear picture of what’s going on.
First, sign up for an account at https://www.elastic.co/cloud/
Once that’s set up, you’ll see your Cloud ID, which you’ll need in the next steps, so keep that handy. Now SSH into your VM, and let’s start shipping info.
Ship Apache Logs
First install Filebeat. Check for the latest version when you do this, you’ll usually want the latest since they release very often
curl -L -O https://artifacts.elastic.co/downloads/beats/filebeat/filebeat-7.4.1-amd64.deb
sudo dpkg -i filebeat-7.4.1-amd64.deb
Next, edit the config
vi /etc/filebeat/filebeat.yml
Scroll down, find and uncomment the cloud.id and cloud.auth lines, and add your cloud id and password. Ex:
cloud.id: ":hakjsdhKJHakjdhghjkgdagJHDGJHASgjhgdjgasJHGDJHKAsghghdgaSHGDHGAjhsgdgaHGHDGjkhk=="
cloud.auth: "elastic:mhjfagsiuhgiufasgJKHGHGjhgdajhsg"
Save and exit (hit Esc, then type :wq and hit enter)
Enable and configure the apache module
sudo filebeat modules enable apache
You can view and update settings in /etc/filebeat/modules.d/apache.yml, but the defaults are good for now.
Start filebeat
sudo filebeat setup
sudo service filebeat start
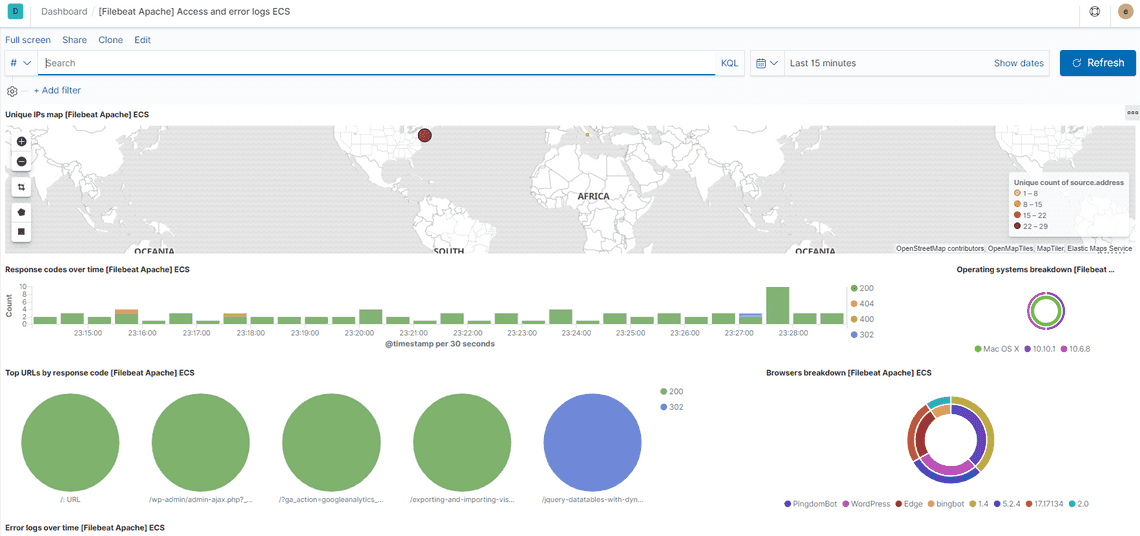
Now you should see a new dashboard created in kibana:
Install Auditbeat
Auditbeat ships syslogs (audit logs) from linux, and in our case WP fail2ban records all wordpress events to syslog, so we get a lot of important data.
curl -L -O https://artifacts.elastic.co/downloads/beats/auditbeat/auditbeat-7.4.1-amd64.deb
sudo dpkg -i auditbeat-7.4.1-amd64.deb
Modify /etc/auditbeat/auditbeat.yml to set the connection information for Elastic Cloud. Scroll down, find and uncomment the cloud.id and cloud.auth lines, and add your cloud id and password. Ex:
cloud.id: ":hakjsdhKJHakjdhghjkgdagJHDGJHASgjhgdjgasJHGDJHKAsghghdgaSHGDHGAjhsgdgaHGHDGjkhk=="
cloud.auth: "elastic:mhjfagsiuhgiufasgJKHGHGjhgdajhsg"
Save and exit (hit Esc, then type :wq and hit enter)
Start auditbeat
sudo auditbeat setup
sudo service auditbeat start
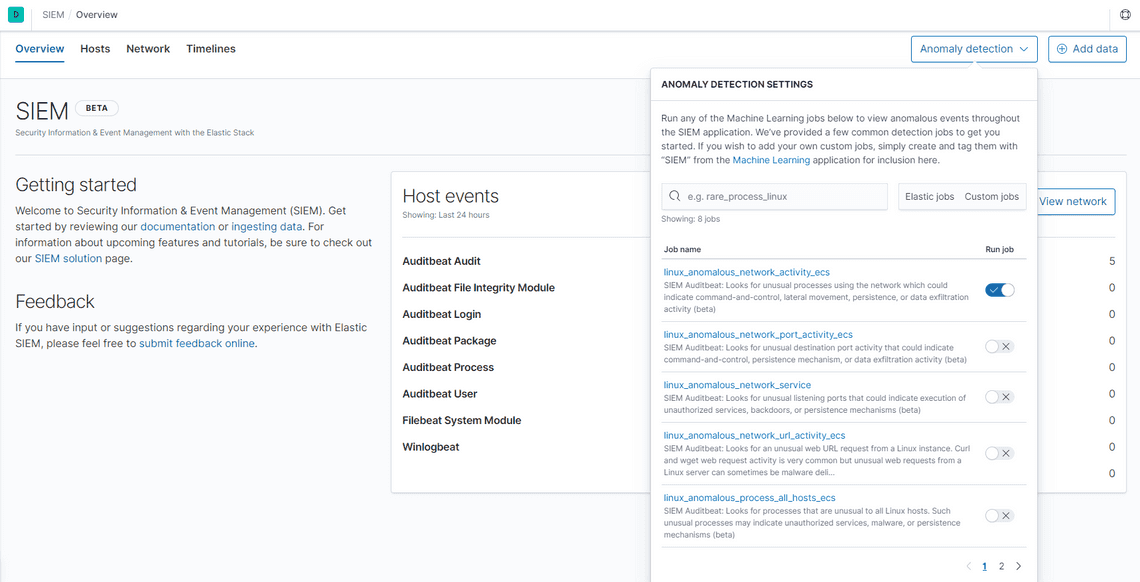
Next go to SIEM, and turn on some of the Anomaly detection machine learning jobs. ML jobs are quite resource intensive, so experiment to see which ones bring you the most value.
You can also configure uptime monitoring, text log shipping from other services you might have running, and much more.
Uptime
Pingdom basically monitors your website from hundreds of locations worldwide, and alerts you when your website is unreachable. It also has Page Speed, Transaction and RUM monitoring available. But for now, let’s configure uptime monitoring. After creating an account, go to Experience Monitoring -> Uptime and click Add New

Next name your check, choose the type of check (ex: Web HTTP(S)), select https:// and enter your website address
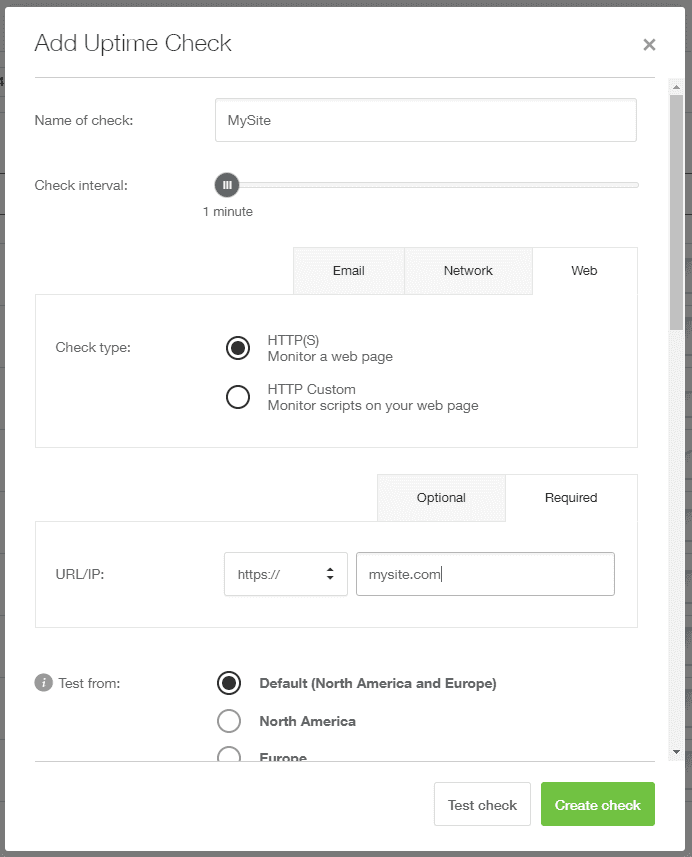
Then hit Create check, and it’ll take care of the rest and alert you if it can’t reach your site with the configured parameters.
Install Site Kit by Google
https://wordpress.org/plugins/google-site-kit/

Once installed, click the Start Setup button as shown above. Next sign in with your Google account and allow access to your site’s Google Account data, and follow the wizard to set up your site in Search Console. Once done, click Go to my Dashboard.
Next, connect Analytics and PageSpeed Insights, and if using Ads, also connect AdSense.

Click the Connect Service button for Analytics, and follow the permission prompts to grant necessary permissions.

Select the account, property and view for your site, and click Configure Analytics.
Next click on Connect Service for PageSpeed Insights. This doesn’t require any special configuration, and will display a PageSpeed Insights widget at the bottom of your Site Kit dashboard. Google takes web performance seriously, and slow page loads will cause your search ranking to be affected, and possibly flag your website as slow and tag it with a badge, warning users so they know what to expect.

Checking this dashboard frequently is useful to catch any accidental slowdowns due to misconfiguration or oversight.
Heading to Settings - Connect More Services allows you to also connect Optimize, a service that lets you create free A/B tests, and Tag Manager, which allows you to manage tags without code changes.
Continuous performance monitoring
Finally, check out sitespeed.io for continuous performance monitoring, which integrates with most of the sites configured above, and can give you a great long-term understanding of your site’s behavior.
Subscribe To My Newsletter
Quick Links
Legal Stuff


