Table Of Contents
Elasticsearch continues to add features at an astonishing rate, and people find really creative ways to use them and enhance it even more. What Neo4j can do is just way too cool to pass on. So we’ll look at how to ingest data with elasticsearch and analyze the data with neo4j. Combining the two helps us achieve some really powerful solutions.
I originally was intrigued by elasticsearch for log aggregation and its capability to instantly aggregate and search over millions of records. We could ship logs from all sorts of data sources like application logs, web server logs (Nginx, IIS). Then we can filter through those logs in Kibana’s Discover, choose the columns we wanted to see for particular use-cases and create saved searches. This immediately made it useful to us, the engineering team. We then use query-based filtering to add restrictions on documents people should access, and with field-level security, we can control which fields they even see inside each document. All of a sudden we have the ability to give our level 1 support real-time visibility into customer issues, without overloading them. On top of this, we add Windows event logs and Syslogs and create some alerts.
We start sending system metrics like memory and CPU usage, and it becomes useful to the infrastructure team for capacity planning. This leads to teams sharing indices across products and correlating logs across several microservices used by a customer during a session. We then start having dashboards optimized for each team, with everyone looking at this emergent Systems Engineering project with everyone building upon everyone else’s data, and everyone working with the same data, but without any restrictions on how they can interact with it.
Ingesting Data from Other Sources
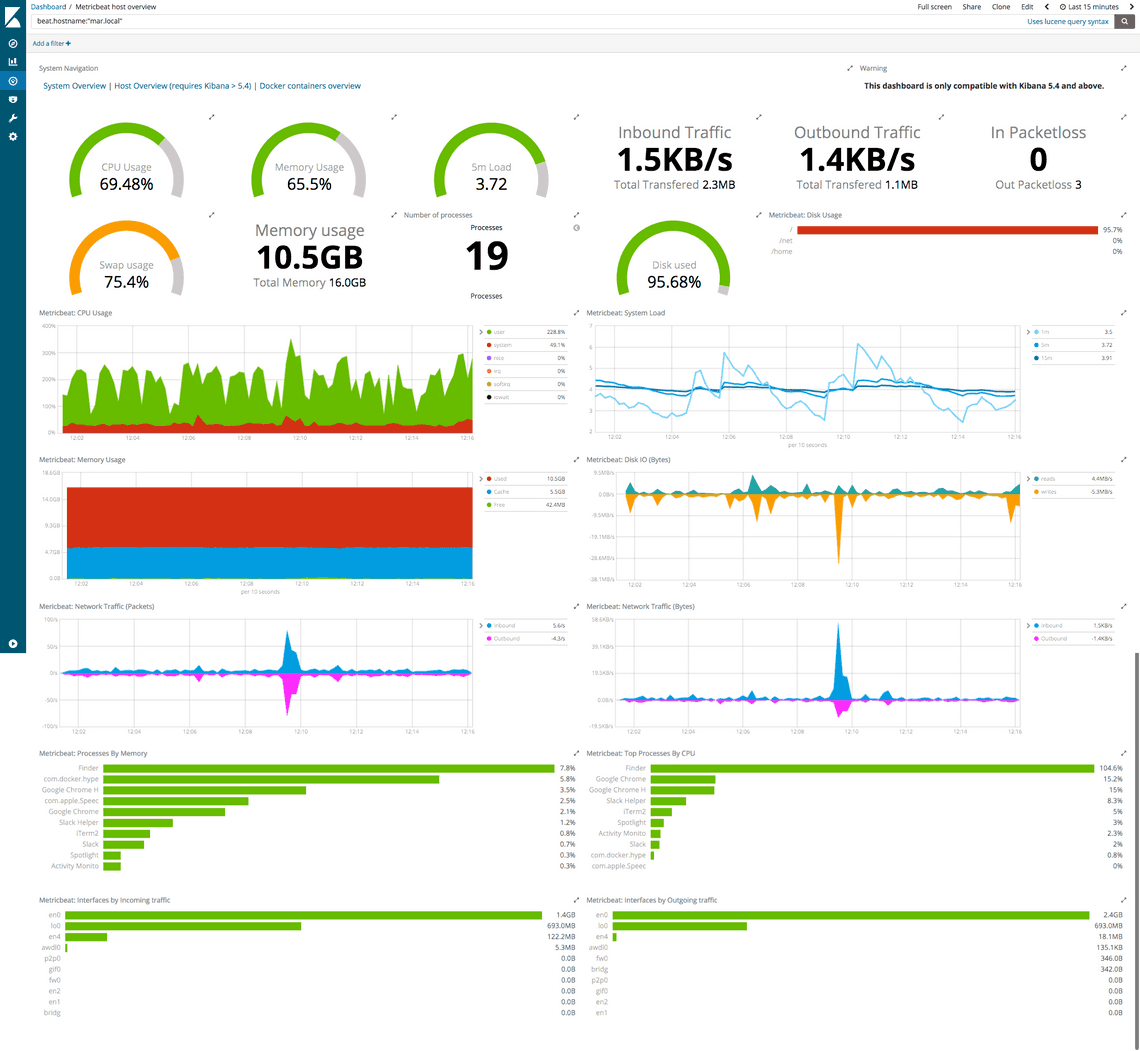
We are of course not limited in any way as to what type of data we can ingest. Adding firewall logs and maybe some NetFlow data can add value. Capturing data from honeypots centrally allows us to catch threats in real-time. We can of use metricbeat to connect into our Kafka and Redis clusters and capture statistics and tag the data with the location of the data center or part of the business it serves.
https://www.elastic.co/guide/en/beats/metricbeat/current/metricbeat-modules.html
And we can use filebeat to get logs from all our 3rd party dependencies like MySQL, or Suricata IDS/IPS, and even about our cloud infrastructure with hooks into GCP, AWS, and Azure.
https://www.elastic.co/guide/en/beats/filebeat/current/filebeat-modules.html
Expanding Elasticsearch to more Domains
With the merging of Elastic and Endgame, we start to ship data from every endpoint in our network and create an antivirus system that can really take advantage of the full picture of what’s happening in your network.
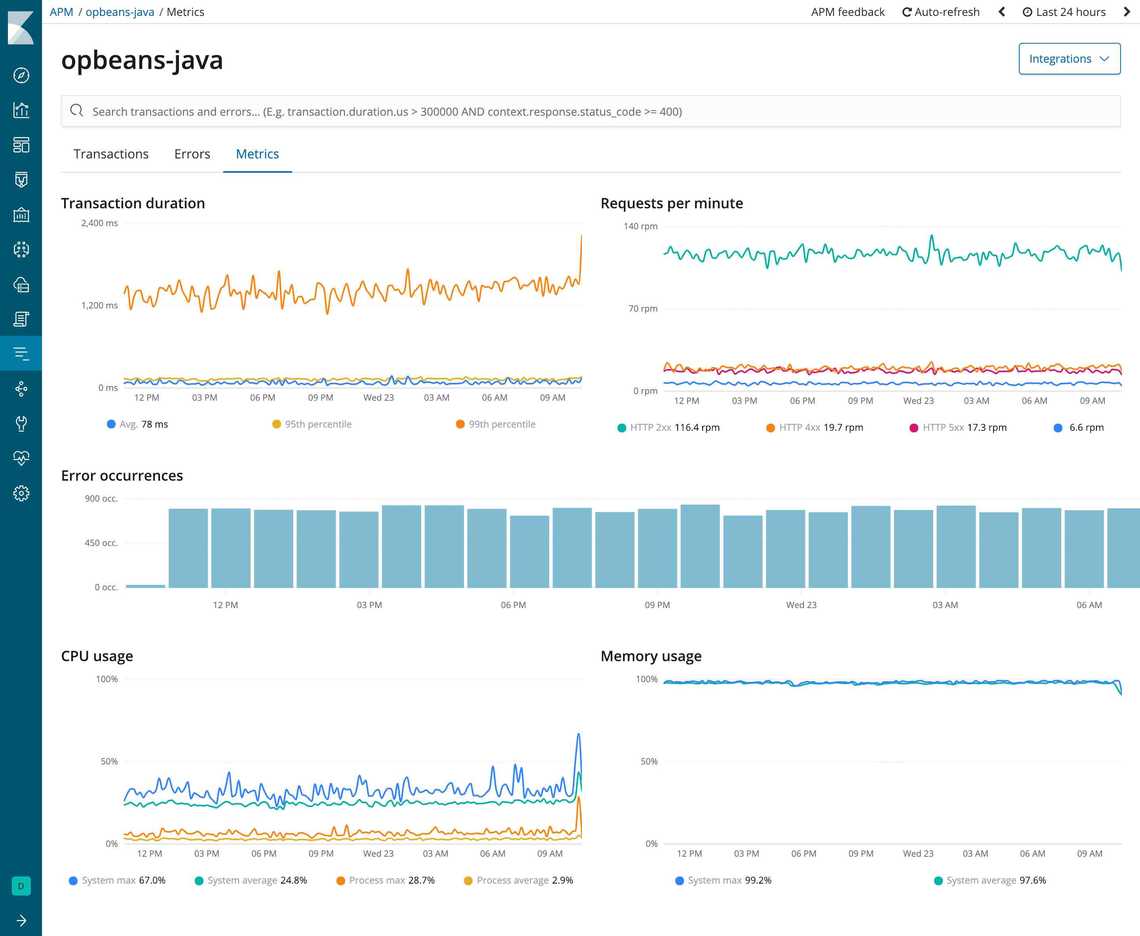
Adding Application Performance Monitoring into each application starts to understand what’s happening inside the normal flow of each one of your applications, and what normal looks like. This leads to a level of observability of our entire infrastructure, globally, and incredibly granular of absolutely incredible value.
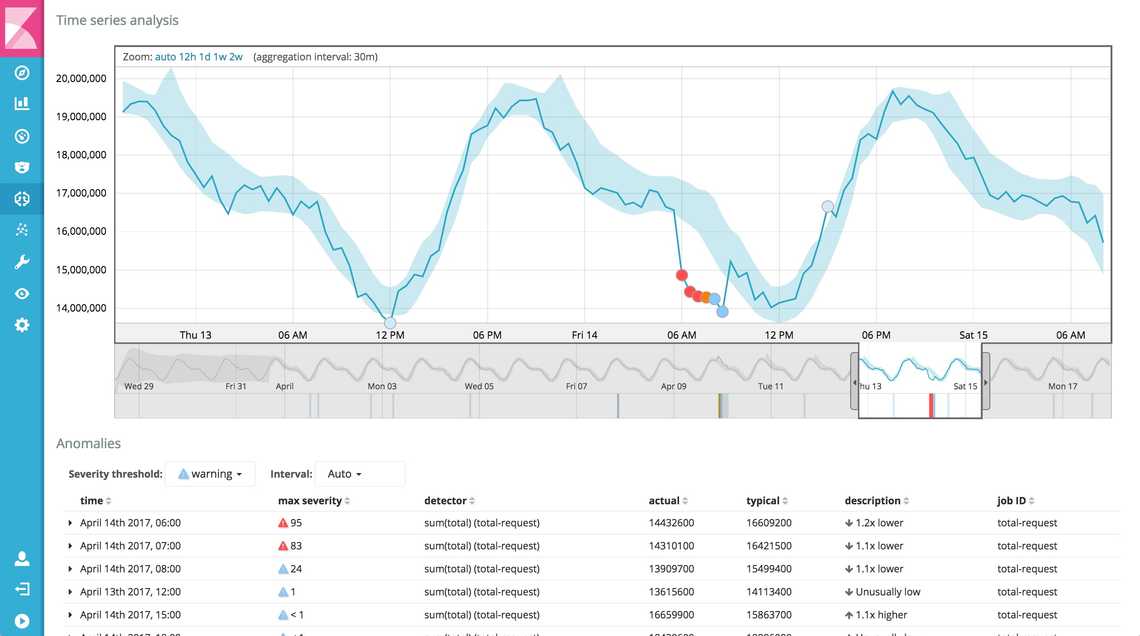
On top of all this, we add Machine Learning, the trained unattended anomaly detection kind, and we really have the system itself understand what normal CPU across each VM looks like; what normal network traffic and normal DNS patterns look like. We automatically get notifications when something out of the ordinary happens, and we can effortlessly track it down to the root cause. Combining anomalous alerts across multiple different types of data models lets you really get a clear picture of where the problem really is.
Globally Scalable
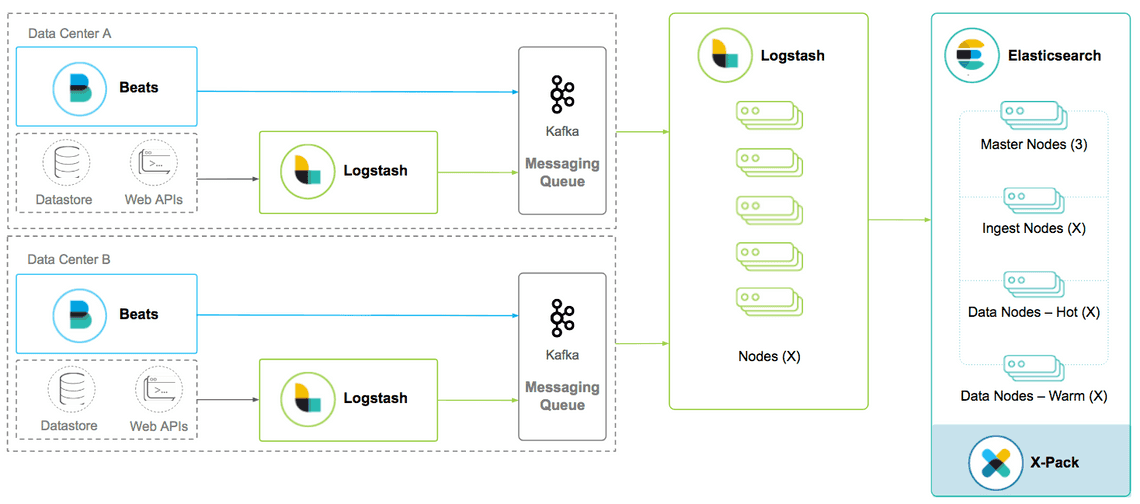
One of the things Elasticsearch has done incredibly well from the get-go was its ability to scale horizontally. Indices can be sharded across many servers and replicated in a way that creates both safety and speed. Having a cluster of 200 elasticsearch nodes isn’t necessarily for everyone, but companies that need that can just set that up and if they do it properly, it works. Companies have gone even larger, since the early days of Elasticsearch.
https://underthehood.meltwater.com/blog/2018/02/06/running-a-400+-node-es-cluster/
Ingesting and Enriching Data
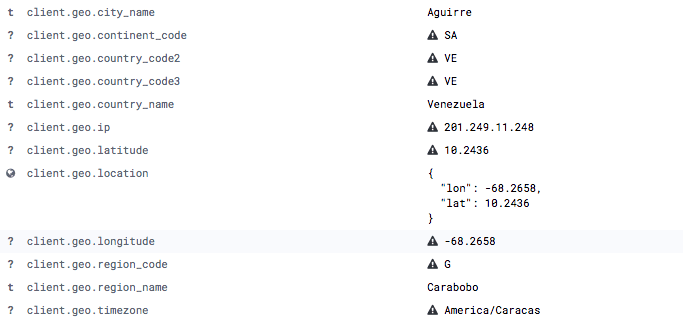
A scalable ingesting pipeline might have Logstash servers distributed throughout each subnet in our global network, handling data transformations and enrichment. Any IP addresses can be enriched with GeoIP information. Dates can be standardized regardless of what format they come in as. Properties can be renamed to keep consistency across applications. And a user-agent string can be turned into detailed information about the user's browser version and operating system.
Realizing Value
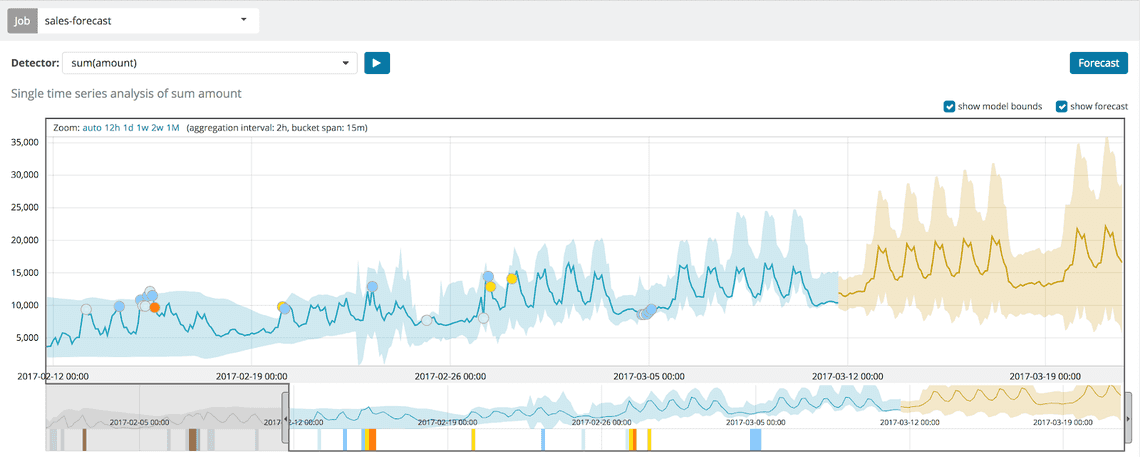
All this data can seem overwhelming, but it all has value to someone. And having it all in the same place means that everyone is seeing the same thing. If contradictions arise, you have all the data needed to create another visualization that answers the confusion. But when we have machine learning, and the system finds patterns, it starts to get interesting when Elastic brings in Forecasting. This means more than just relying on current data, we have data now that can tell us that we should pre-order some servers for next month because we’re outgrowing our resources. Or we can add financial data, and be alerted that a customer’s spending has all of a sudden increased and we need to pay attention.
Let’s Get Creative
So far we’ve been just in the world of Elastic, but the integration part goes both ways, and any data you put in, can be made available to any other pipelines you need; and then data from those can be ingested back.
We have all this data that includes IP addresses of VMs, and application data that tells us when each user is likely to log onto a system. Adding to that data about which VM lives on which host, and which ethernet cable is plugged into which switch and router, and other infrastructure data we collect, really starts to make it possible to answer some really interesting questions.
Let’s find the most depended-upon component in our infrastructure
MATCH       (n)<-[:DEPENDS_ON*]-(dependent)
RETURN      n.host as Host,
            count(DISTINCT dependent) AS Dependents
ORDER BY    Dependents DESC
LIMIT       1
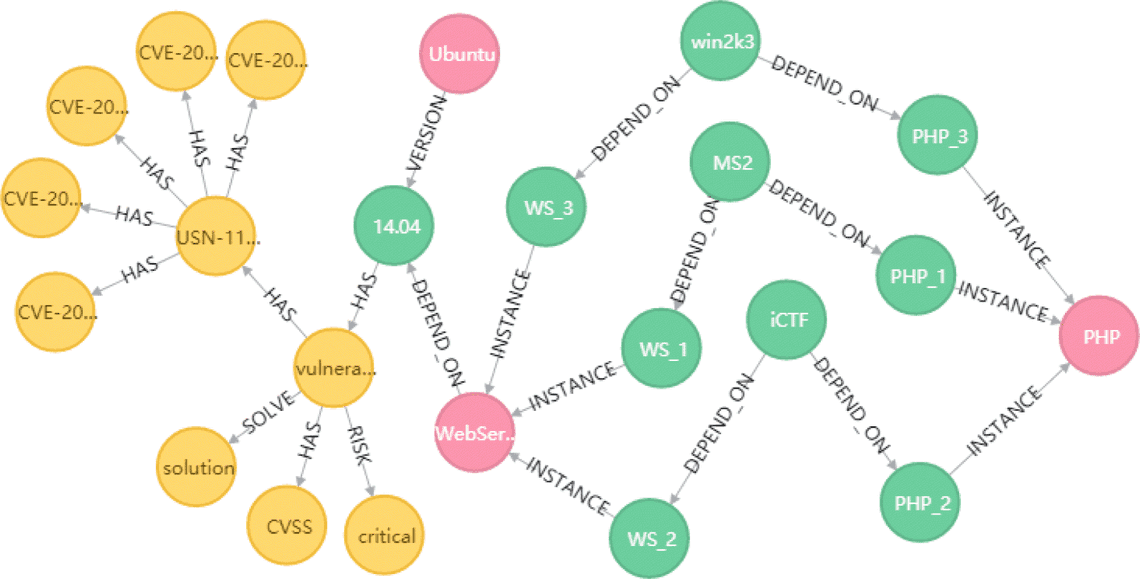
Or maybe map out and analyze CVEs
Taking it a few steps forward, we can ask: Give me a list of email addresses of users which are likely to log on between 10-11 PM ET on Tuesday and use an application which lives on a VM which sits on a host, who’s traffic passes through Router NY2 and doesn’t have a redundant route between the user and the application. Because I want to email just those users that I’ll be doing maintenance on that router. This is actually a pretty simple graph problem, and in Neo4j / Cypher [query language] it might look something like this
// First let's find all the users active during that time that have passed through that router on a Tuesday between 10 and 11PM
MATCH (u:User)->[appusage:USED_APPLICATION]->(app:Application)->[:DEPLOYED_ON]->(:VirtualMachine)->[:HOSTED_ON]->(host:Host)->[:CONNECTED_TO]->(r1:Router)->[:ROUTES_TO]->(internet:Internet)
WHERE datetime(appusage.date).dayOfWeek == 2 AND datetime(appusage.date).hour == 22 AND r.name == "NY2"
WITH collect(u.email) as usersRouter1

MATCH (u)->[appusage]->(app)->[:DEPLOYED_ON]->(:VirtualMachine)->[:HOSTED_ON]->(host)->[:CONNECTED_TO]->(r2:Router)->[:ROUTES_TO]->(internet)
WHERE NOT(r1=r2)
WITH collect(u.email) as usersRouter2

RETURN [x in usersRouter1 WHERE not(x in usersRouter2)] as affectedUsers
https://neo4j.com/business-edge/managing-network-operations-with-graphs/
https://neo4j.com/docs/cypher-manual/current/functions/temporal/#functions-datetime-temporal
https://neo4j.com/graphgist/information-flow-through-a-network
The following article has a lot more dependency chain analysis examples:
https://neo4j.com/graphgist/network-dependency-graph
Setting up Neo4j
Download the Neo4j Community Server from https://neo4j.com/download/ or install with a package manager like Chocolatey, apt-get or yum. If you’re installing Neo4j for the first time and testing things out, I recommend installing Neo4j Desktop. It comes with great visualizations and neo4j servers included. I’ll continue the setup example using neo4j Desktop as it’s more graphical, but you can also connect Neo4j Desktop to your community server.
choco install neo4j-community -packageParameters "/Install:C:\Apps\Neo"
yum install neo4j
apt-get install neo4j
Create your Graph
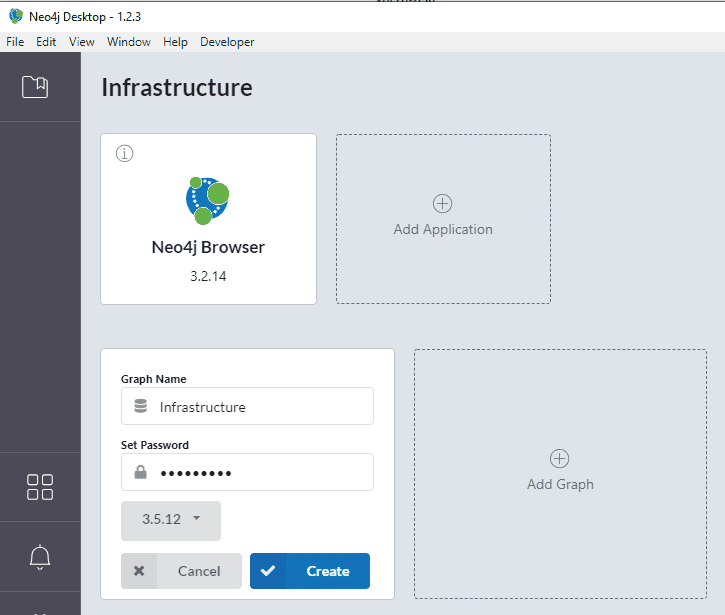
First, let’s create a new graph and call it Infrastructure. I noticed a trend with a lot of big companies to create interconnected data systems that graph incredible amounts of data that might not be obviously connected, so you might want to name it something broader than Infrastructure.
Install Plugins
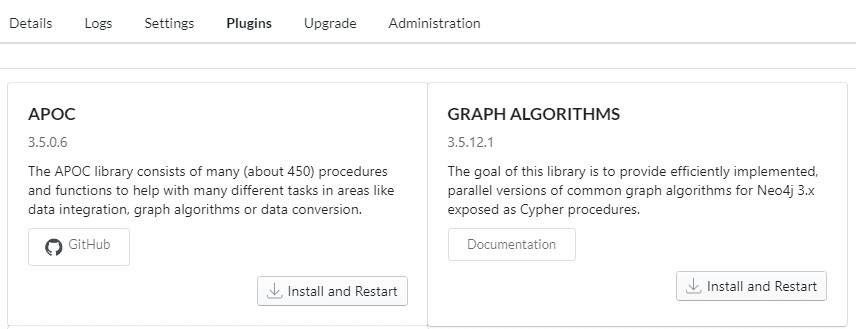
Plugins extend the graph functionality with new features. The APOC and Graph Algorithms libraries contain a lot of algorithms that are going to be very useful for graph analysis, so let’s install them.
Get Data Into Neo4j
###Importing data from CSV
One of the simplest ways to import data into neo4j is to load it from a .csv. Here we’ll create a CSV with headers hostname, dc, os, and last and save it in neo4j’s import directory. Neo4j by default blocks local files from only being allowed to be read from the import folder, which is different on each system. On Neo4j Desktop, click the Open Folder button to find it

Other OS’s: https://neo4j.com/docs/operations-manual/current/configuration/file-locations/
CREATE INDEX ON :VM(hostname);
CREATE INDEX ON :Datacenter(name);
CREATE INDEX ON :OperatingSystem(name);

LOAD CSV WITH HEADERS FROM 'file:///vm.csv' AS data
WITH data WHERE data.hostname IS NOT NULL
MERGE (vm:VM {hostname: data.hostname}) SET vm.memory = round(toFloat(data.memory)/1024/1024/1024) + " GB", vm.last_updated = data.last
MERGE (dc:Datacenter { name: data.dc })
MERGE (os:OperatingSystem { name: data.os })
MERGE (vm)-[:IS_IN]->(dc)
MERGE (vm)-[:USES_OPERATING_SYSTEM]->(os)
Import data from external JSON
We can just as easily load data from external sources as JSON
CALL apoc.load.json("https://onodo.org/api/visualizations/21/nodes/") yield value
CREATE (n:Person) set n+=value
WITH count(*) as nodes
CALL apoc.load.json("https://onodo.org/api/visualizations/21/relations/") yield value
MATCH (a:Person {id:value.source_id})
MATCH (b:Person {id:value.target_id})
CALL apoc.create.relationship(a,value.relation_type,{},b) yield rel
RETURN nodes, count(*) as relationships
Conditionally Create Relationships
This one’s a bit hacky maybe, but sometimes the raw structure of our data might need us to only crate a relationship if the value is not an empty string
...
FOREACH (ignoreMe in CASE WHEN data.Company <> "" THEN [1] ELSE [] END |
    MERGE (organization: Organization { name: data.Company })
    MERGE (user)-[:IN_ORGANIZATION]->(company)
)
Connect Neo4j to Elasticsearch
Getting data in manually is ok, and the above can be put on a schedule, where one process exports data into CSV and makes it accessible in a folder or remote location like an FTP. Then another scheduled task runs the import query. But we can take a step here to cut out the middle step in the process, and just connect the 2 systems directly. This simplifies our architecture, which means fewer parts that are likely to fail.
Create a new user in Neo4j
Create a new user you’ll use later for connecting from logstash.
CALL dbms.security.createUser("elastic", "f@ncy9a$w0rd", false)
Trust elasticsearch certificate
Download the public key certificate from your elasticsearch cluster, and let’s add it to the trust store.
keytool -import -trustcacerts -keystore /etc/pki/java/cacerts -storepass changeit -alias elkcert -import -file elk.cer
Connect to elasticsearch
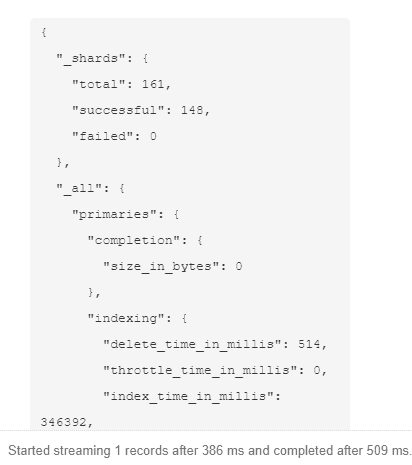
apoc.es.* is the procedure pack that makes it all possible. Let's try it out and just fetch some stats

call apoc.es.stats("https://user:password@elasticsearchserver:9200")
We should get something like this
Import Structured Data From Elasticsearch to Neo4j
Next, we’ll create a paged query, which uses the Scroll API (similar to a cursor in SQL) to load paged data from elasticsearch, and process one record at a time. First, we’ll get a chunk of data, and then we’ll use the scrollId to iterate through the rest of the results.
// It's important to create an index to improve performance
CREATE INDEX ON :Document(id);
// First query: get first chunk of data + the scroll_id for pagination
CALL apoc.es.query('localhost','test-index','test-type','name:Neo4j&size=1&scroll=5m',null) yield value with value._scroll_id as scrollId, value.hits.hits as hits
// Do something with hits
UNWIND hits as hit

// Here we simply create a document and a relation to a company
MERGE (doc:Document {id: hit._id, description: hit._source.description, name: hit._source.name})
MERGE (company:Company {name: hit._source.company})
MERGE (doc)-[:IS_FROM]->(company)
// Then call for the other docs and use the scrollId value from previous query
// Use a range to count our chunk of data (i.e. i want to get chunks from 2 to 10)
WITH range(2,10,1) as list, scrollId
UNWIND list as count

CALL apoc.es.get("localhost","_search","scroll",null,{scroll:"5m",scroll_id:scrollId},null) yield value with value._scoll_id as scrollId, value.hits.hits as nextHits
// Again, do something with hits
UNWIND nextHits as hit
MERGE (doc:Document {id: hit._id, description: hit._source.description, name: hit._source.name})
MERGE (company:Company {name: hit._source.company})
MERGE (doc)-[:IS_FROM]->(company) return scrollId, doc, company
Loading Aggregated Data from Elasticsearch to Neo4j
If our data source isn’t structured, say we just ingest logs, but we already indexed them, and can extract useful data from aggregations, it might be more efficient to just ingest aggregations. For this, we need to rely on apoc.es.postRaw and compose our own JSON aggregation definition. We’ll also limit our aggregation over a specific time span, which we can use later to optimize our scheduled task.
call apoc.es.postRaw("localhost", "filebeat-*/_search?rest_total_hits_as_int=true&ignore_unavailable=true&ignore_throttled=true", "{\"aggs\":{\"hosts\":{\"terms\":{\"field\":\"agent.hostname\"},\"aggs\":{\"cloud\":{\"terms\":{\"field\":\"cloud.provider\"}}}}},\"size\":0,\"query\":{\"bool\":{\"filter\":[{\"range\":{\"@timestamp\":{\"format\":\"strict_date_optional_time\",\"gte\":\"2019-11-20T13:40:45.890Z\",\"lte\":\"2019-12-05T13:40:45.890Z\"}}}]}}}")
The query above expanded for readability:
{
  "aggs": {
     "hosts": {
       "terms": { "field": "agent.hostname" },
       "aggs": {
          "cloud": {
            "terms": { "field": "cloud.provider"  }
          }
       }
     }
  },
  "size": 0,
  "query": {
    "bool": {
      "filter": [
        {
          "range": {
            "@timestamp": {
              "format": "strict_date_optional_time",
              "gte": "2019-11-20T13:40:45.890Z",
              "lte": "2019-12-05T13:40:45.890Z"
            }
          }
        }
      ]
    }
  }
}
Our response will be grouped into aggregation buckets looking like this
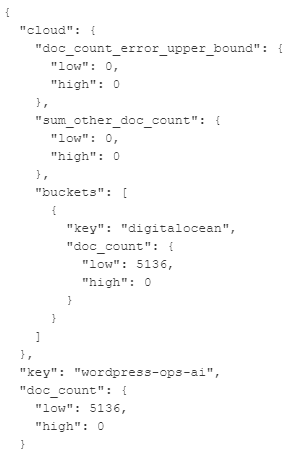
Now we can form our import logic based on these aggregations, and create our model.
call apoc.es.postRaw("localhost", "filebeat-*/_search?rest_total_hits_as_int=true&ignore_unavailable=true&ignore_throttled=true", "{\"aggs\":{\"hosts\":{\"terms\":{\"field\":\"agent.hostname\"},\"aggs\":{\"cloud\":{\"terms\":{\"field\":\"cloud.provider\"}}}}},\"size\":0,\"query\":{\"bool\":{\"filter\":[{\"range\":{\"@timestamp\":{\"format\":\"strict_date_optional_time\",\"gte\":\"2019-11-20T13:40:45.890Z\",\"lte\":\"2019-12-05T13:40:45.890Z\"}}}]}}}") yield value with value.aggregations.hosts.buckets as buckets

UNWIND buckets as data
MERGE (vm:VM {hostname: data.key})
Full command reference: http://neo4j-contrib.github.io/neo4j-apoc-procedures/3.5/database-integration/elasticsearch/
Importing Data Automatically on a Schedule
We have a lot of scheduling options overall, but with keeping dependencies to a minimum, let’s schedule our imports to run from right within Neo4j
CALL apoc.periodic.repeat('importVMs',
    'call apoc.es.postRaw(...) yield value with value.aggregations.hosts.buckets as buckets
     UNWIND buckets as data
     MERGE (vm:VM {hostname: data.key})',
60 * 60)
Create Some Useful Queries
Now that we have aggregated data represented as a graph, maybe the state of our environment at a given time, we can start to extract some insights. Here are some ideas
Find email addresses of users which use application A and application B
MATCH (a:Application)<-[:USES_APPLICATION]-(u:User)-[:USES_APPLICATION]->(b:Application)
WHERE a.name='Salesforce' AND b.name='Splunk'
RETURN u.email;
Find email addresses of users who use application A and application B and are not employees of Facebook
MATCH (a:Application)<-[:USES_APPLICATION]-(u:User)-[:USES_APPLICATION]->(b:Application), (u)-[:IN_ORGANIZATION]->(org:Organization)
WHERE a.name='Salesforce' AND b.name='Splunk' AND org.name<>'Facebook'
RETURN u.email;
List organizations and count of users who use more than one application and are not your employees
MATCH (a:Application)<-[:USES_APPLICATION]-(u:User)-[:USES_APPLICATION]->(b:Application), (u)-[:IN_ORGANIZATION]->(org:Organization)
WHERE org.name<>'My Company' AND a<>b
RETURN org, COUNT(u) ORDER BY COUNT(u) DESC
Other ideas
https://neo4j.com/blog/knowledge-graph-search-elasticsearch-neo4j/
https://neo4j.com/graphgists/?category=network-and-it-operations
Related Posts
Subscribe To My Newsletter
Quick Links
Legal Stuff


